Being almost a daily user of Tropy and other associated tools from Digital Scholar community, and being responsible for orchestrating historically valued data, it would be of great help to provide some standard statistical analysis in Tropy itself.
In addition it can have Timelinejs, integrated within it, (probably metadata needs to be provided and matched between tropy and timelinejs), so that it helps to:
visuallize the records based on time information available in the metadata
Great idea! We’ve been discussing something like a project stats page on and off. Speaking for myself, I really welcome the idea of ‘adding stats’ but I think what’s been holding us back so far were concrete use cases. That is to say, there are obviously all kinds of numbers we can read out of a project, in fact, we sort of started doing a little bit of this in the list of recent projects in the new project window, where we list the numbers of items, notes, etc. The idea of having some stats to give an overview of a project is enticing, but we haven’t really found a set of metrics that are actually interesting. Could you talk a little bit about the kind of standard statistical analysis that would be useful to you?
Regarding timelines and specifically Timeline JS I’d have to look into their requirements but I would imagine that this could be a good case for an export plugin: You select a set of items and export either the final Timeline JS page or the raw data in exactly the required format.
Furthermore, we’ve had the idea in the past to build timelines into the Tropy UI itself for navigational purposes similar to search: i.e., you select a point or range on a timeline and the project to filter the item list.
Yes, a plugin should be enough for bringing out “Timeline” object based on the list of items selected/grouped/queried satisfying a particular condition or based on the semantic metadata field. I have heared about PeriodO but couldnt figure it much about how that shall be useful here. And particularly on Timelinejs, there is a exhibit side plugin in OmekaS which some institutions and communities using it already.
The main reason why research data management need a Spatio-Temporal-Thematic framework (a conceptual framework that i drawn out while learning by doing) is that the data which are most of the times are primary sources, need to stay historical, just to avoid it from becoming ahistorical.
Basic state of items, media, metadata, notes, selection, tags etc…
Geospatial statistics (hotspots…) based on lat, lon geometrical data when provided and available
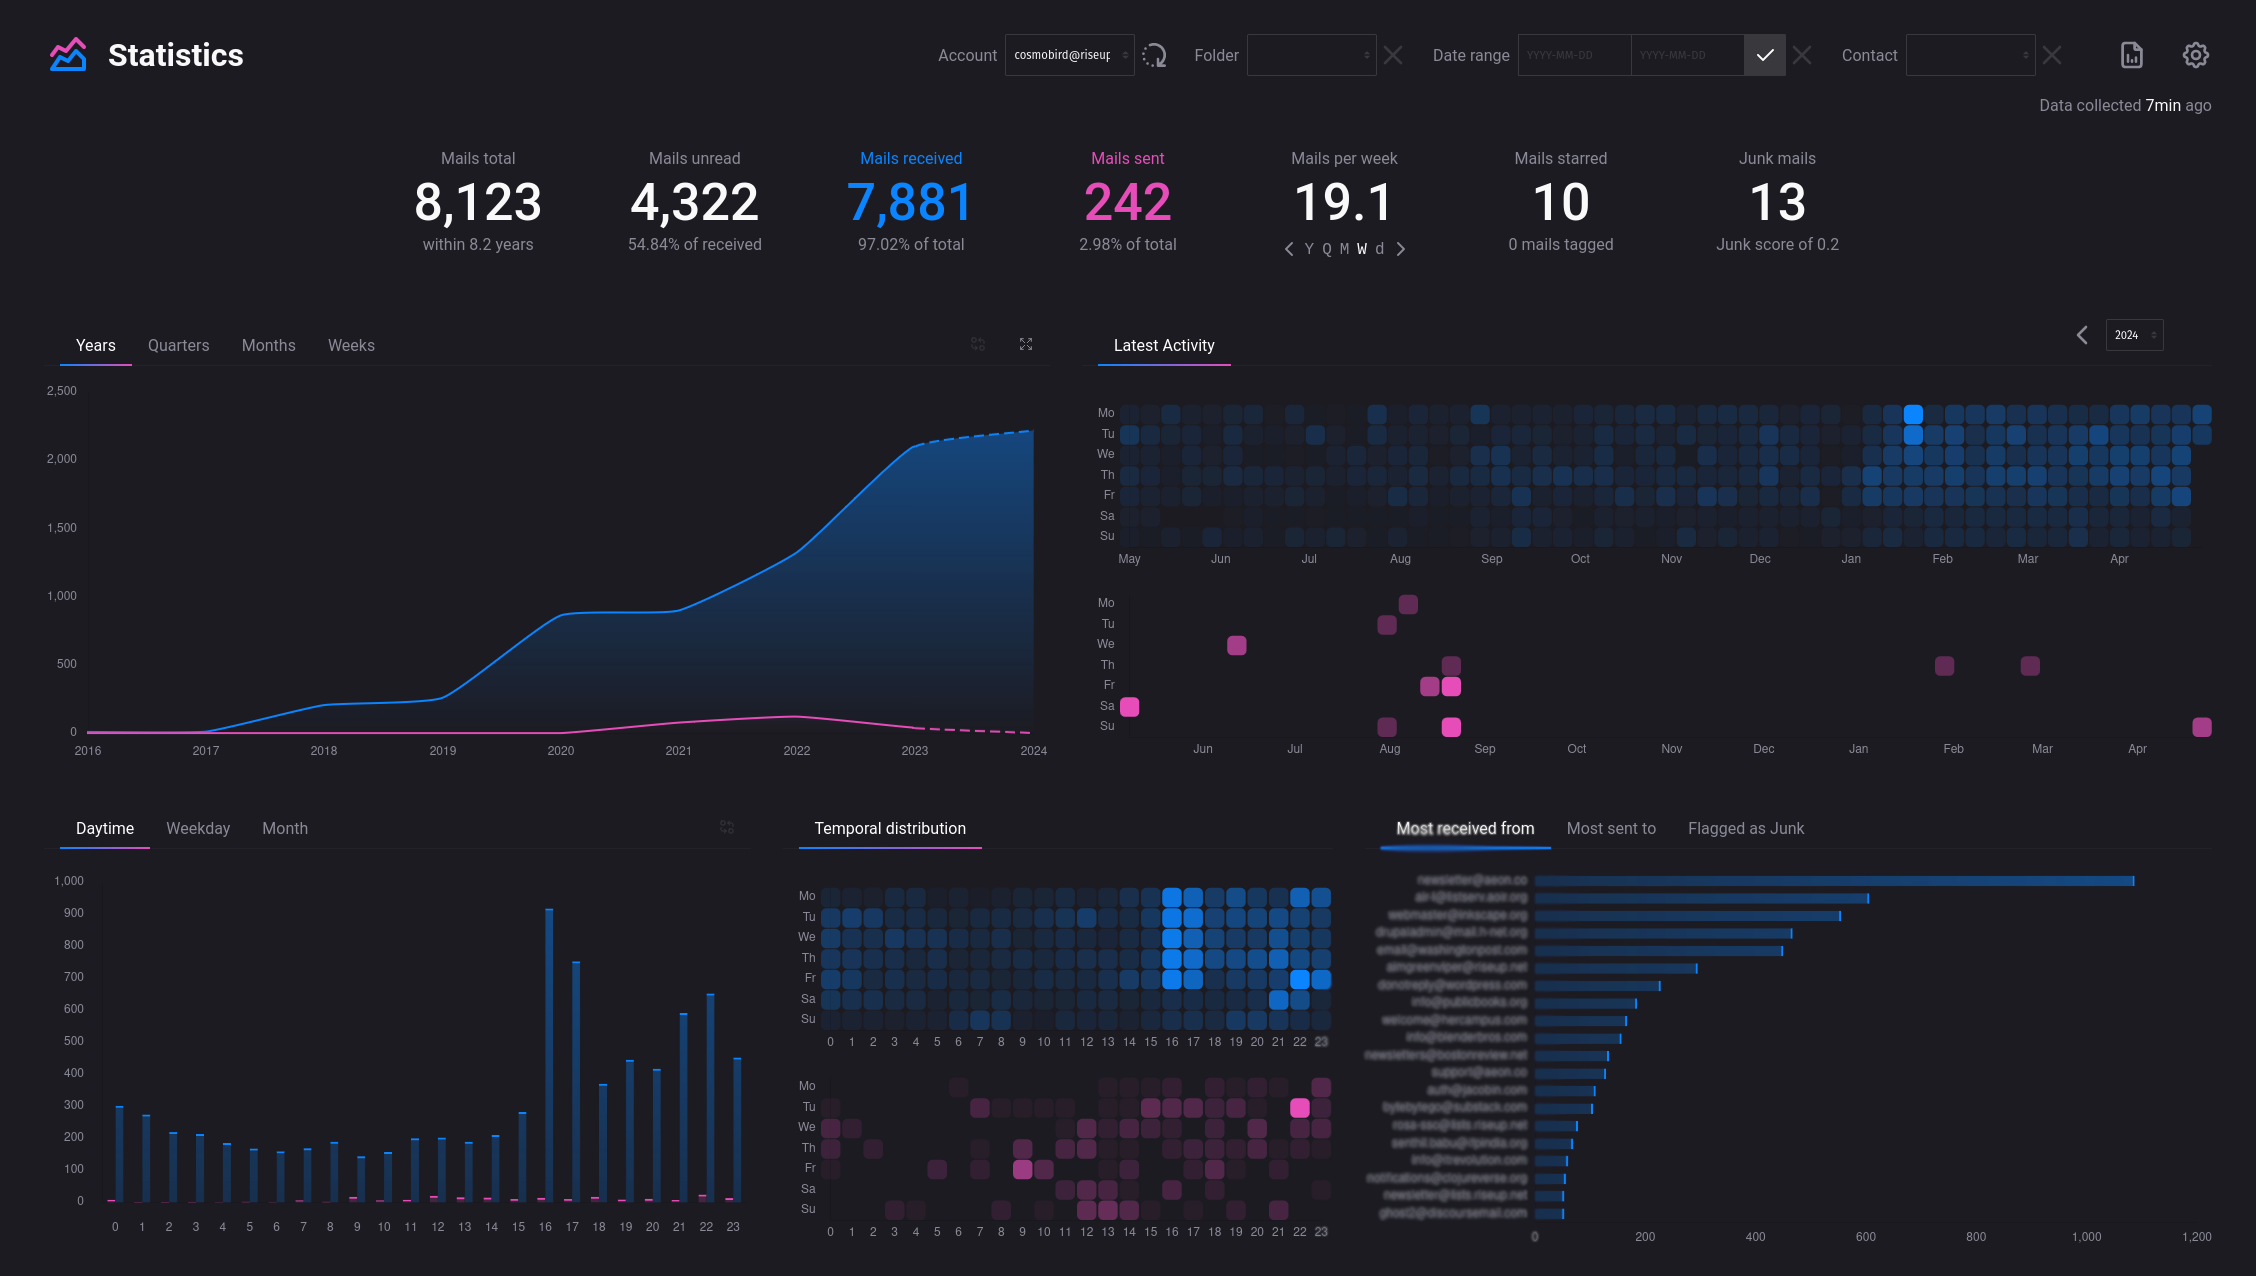
A general timeline exploration statistics just similar to what is available in Thunderbird would be useful(but a more interactive one would be great)
Simple visuals like pie chart that would elucidate what lists contain how much items and further down the hierarchy.
General stats of what kind of media is being catalogued in tropy. Like PDF documents, photos, audio, video, 3d data, etc… based on their formats
I will update on the metrics with which RDM and History works would find useful soon - by conversing with the information scientists and historians i work along with.